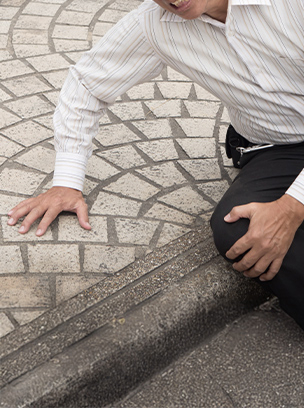


If you have received a denial letter for your Social Security Disability benefits, you are likely frustrated, confused, and worried about your financial future. You are also not alone.
The Social Security Administration (SSA) denies the majority of initial claims. However, your chances of approval vary significantly depending on where you live, which local field office handles your claim, and which Administrative Law Judge (ALJ) presides over your hearing.
Don’t rely on national averages. Use our interactive tool below to see the specific approval and denial statistics for your city and state.
Social Security Disability Approval & Denial Rates by City + State
Current Data for Fiscal Year 2025
| Judge / Region ▾ | Hearing Office ▾ | Total Cases ▾ | Denial Rate ▾ |
|---|---|---|---|
| NATIONAL AVERAGE (2025) | - | 427,905 |
29.05% Denied
AVG
|
| Loading full judge list... | |||
Search above to see your judge's personal approval rate.
National averages don't tell your story. Some judges approve 95% of claims. Others deny nearly half. Knowing your judge's tendencies — and preparing your file accordingly — is the difference between approval and denial.
Or call us now: (702) 820-1692
How to Interpret Your Results
When viewing the statistics above, it is critical to understand that a “Denial” at one stage does not mean your case is over. The Social Security system is designed as a funnel.
1. Initial Application Level
This is the first step. Nationally, the denial rate here is historically high (often 60-70%). If you see a high denial rate for your local field office, do not be discouraged. Most successful claims must move past this stage to be approved.
2. Reconsideration
If denied initially, you ask for a “Reconsideration.” This is essentially asking the same office to look at the same file again. Consequently, approval rates here are statistically the lowest (often hovering around 10-15%).
3. the Hearing Level (where You Can Win)
This is the most critical stage. You will present your case before an Administrative Law Judge (ALJ).
-
The “Human Factor”: Unlike the previous stages, an ALJ has the discretion to weigh your testimony and medical evidence.
-
The Data: This is why our tool shows Judge-Specific Data. Some judges approve 70% of cases; others approve only 20%. Knowing who your judge is can help us tailor your legal strategy.
Why Do Denial Rates Vary so Much by Location?
You might wonder why a claimant in one state has a higher chance of winning than a claimant in another. There are three main factors driving these geographic differences:
-
Case Backlogs: States with higher populations often have overwhelmed field offices. When caseloads are unmanageable, errors in processing can occur, leading to “technical denials” that have nothing to do with your medical condition.
-
The Circuit Courts: Different federal court circuits have different precedents (legal rules) regarding how evidence must be weighed.
-
Vocational Experts: Local labor markets matter. The SSA looks at whether you can adjust to other work. If your local economy is flooded with “sedentary” jobs, it may be harder to prove you cannot work compared to a region with mostly heavy labor jobs.
National Statistics Snapshot (2024-2025)
While local data is most important, understanding the national landscape helps set expectations.
| State | Initial Approval Rate | Hearing Approval Rate | Avg. Wait Time (Months) |
| National Avg | 38% | 54% | 11 Months |
| Hawaii | 52% | 61% | 9 Months |
| Nevada | 36% | 45% | 14 Months |
| Texas | 39% | 42% | 10 Months |
| New York | 41% | 58% | 12 Months |
Data source: Social Security Administration public data sets.
What to Do If You Live in a “high Denial” Area
If our tool shows that your local office has a denial rate of 60%, 70%, or higher, do not panic.
A high denial rate does not mean your disability isn’t real. It usually means the local judges and examiners are stricter regarding medical evidence. It means you cannot afford to have a “thin” file.
To win in a high-denial jurisdiction, you must:
-
Close the Gaps: Ensure there are no long periods without doctor visits in your medical history.
-
Get RFC Forms: Obtain “Residual Functional Capacity” forms from your treating physicians.
-
Hire Representation: Government statistics consistently show that claimants who hire a disability lawyer are three times more likely to be approved than those who represent themselves.
At Shook & Stone, we track these statistics daily. We know the tendencies of the local judges and how to package your medical records to meet their specific standards of proof. Learn more about the advantages of working with legal representation in our guide on Social Security representation with vs. without a lawyer.
Frequently Asked Questions (FAQ)
Which State Has the Hardest Disability Judges?
It varies year by year, but historically, states in the South and certain parts of the Southwest often see lower approval rates at the hearing level. However, variance within a state is often greater than the variance between states. One judge in a hearing office may approve 80% of cases while a judge down the hall approves 30%.
What Are the Chances of Winning a Disability Appeal in 2025?
Nationally, the approval rate at the hearing level (before a judge) generally hovers between 45% and 55%. This is your best statistical chance of winning benefits.
Does the SSA Deny Everyone the First Time?
It can feel that way, but roughly 30-35% of people are approved on the initial application. These are usually cases with catastrophic impairments listed in the SSA’s “Blue Book.” For most people with chronic pain, degenerative conditions, or mental health struggles, a denial is a standard part of the process leading to a hearing.
Don’t Let a Statistic Define Your Future.
The data is just numbers. Your case is about your life. If you are struggling to get the benefits you earned, let us help you build the strongest possible case.